

Water discharge measurements exercise
| Exercise name | Measurements of flow velocity with a discharge meter (OTT MF Pro) |
| Duration of exercise | 1 – 2 days (depending on circumstances) |
| Prerequisite skills | Basic knowledge of the flow measurement principles and analysis of obtained data |
| Number of students | 5 |
| Exercise objective | Students get to apply theoretical knowledge to the water flow velocity measurements. |
| Professors: | Dr. Afete Musliu
MSc Damir Gashi |
| Students: | Master and BA students |
| Theoretical basics: | Determination of velocity flow on an open river system is a standard hydrological task performed on a daily basis by the Hydrometeorological Institutes all over the world.
The following exercise shall teach the students to determine the flow velocity by teaching them the following: – measuring the river’s width and depth – developing a sketch of a riverbed – measuring multiple velocities using a current meter – integrating obtained results and drafting a report on the water discharge in the Ibar river |
| Tasks | 1. Prepare the water flow meter and learn its basic operating principles
2. Measure the river bank width 3. Measure the river depth 4. Present a configuration of the riverbed in a diagram 5. Identify minimum 20 subsections to be measured 6. Measure the flow velocity at each subsection 7. Calculate the total discharge |
Integrated Water Resources Management in Kosovo’ (IWRM-K) is a 12-year transformational Program of the Swiss Agency for Development and Cooperation (SDC) and the Government of Kosovo (https://iwrm-k.com/home)
IBC-M will undertake a Research Project on ‘Qualitative and Quantitative analysis of Ibar river basin in Mitrovica’, aiming at building a long-lasting water resource management capacity in line with Kosovo’s socio-economic and political priorities and contributing to the needs of future sustainable development.
IBC-M will monitor water discharge by using a flow meter purchased through the project to define the biological minimum of the rivers and the eutrophication level in the fresh waters in the research area.
The aim is to apply the scientific approach as a synergy of scientific and technological approaches to obtain overall control over the environmental aspects of the research area, with the possibility of planning for an efficient response to manage the water resources properly.
Mitrovica weather history
The basic climatic characteristic of the municipality of Mitrovica is a moderate-continental climate, a transition between the Mediterranean and the continental climate. The climatic zone of Mitrovica and specifically the Ibar Valley inclines towards continental air masses, meaning that this area has winters that are colder with daily mean temperatures around −5 °C. On the other hand, summers can be very warm, with daily mean temperatures of around 29 °C.
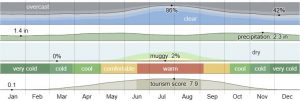
Graph 1. – Mitrovica climate conditions. (source: weatherspark.com)
Average temperatures in Mitrovica
The warm season lasts for 3.3 months, from June 4 to September 13, with an average daily high temperature above 22°C. The hottest month of the year in Mitrovica is July, with an average high of 26°C and low of 13°C. The cold season lasts for 3.4 months, from November 22 to March 3, with an average daily high temperature below 8°C. The coldest month of the year in Mitrovica is January, with an average low of -5°C and a high of 3°C.
Winds
There was no wind at all during the measurement procedure. We had an anemometer with us (wind speed and direction meter) and it showed no wind movements at the time of measurements.
Winds in Mitrovica, in general, are a sporadic meteorological phenomenon. According to a meteorological data the average wind speed in Kosovo varies from is 1.3 m/s to 2.4 m/s up to random extreme wind speeds of approximately 30 m/s that may occur during the spring, but those are extremely rare.
Average monthly rainfall in Mitrovica
To show variation within the month and not just the monthly total, we show the rainfall accumulated over a sliding 31-day period centered around each day.
The average sliding 31-day rainfall during January in Mitrovica is essentially constant, remaining about 23 millimeters throughout and rarely exceeding 54 millimeters or falling below 1 millimeter.
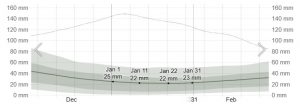
Graph 2. – Mitrovica average monthly rainfall. (source: weatherspark.com)
Weather conditions
The measurements were taken on January 13 2024, at 10.00h, the temperature was 2°C, it was sunny, sky was clear with no clouds in any direction.
Site description
Location was 2 km away from our starting point (IBC-M Riverside campus), in between the residential area known as “Three towers” in North Mitrovica and the old stadium located in South Mitrovica, at coordinates 42°53’22″N 20°51’35″E. The Ibar river is located on the left-hand side of the road, approximately 50m away from it, and it is accessible by the gravel road from the South and the walking path from the North. There is a pedestrian bridge nearby connecting North and South and a construction site (a shopping mall) situated approximately 200m southwest of our measuring site. There were no trespassing signs saying that the location was inaccessible to the population or unauthorized personnel. This location was selected due to the accessibility of the river point, riverbed stability, good conditions for setting up a measuring site on riverbanks and other conditions stated above.
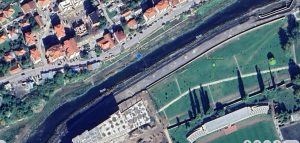
Fig. 1. Google Earth image showing the location of the measurement site.
Safety
IBC-M college is committed to providing a safe and healthy environment for students and its staff, as provided in the college’s Health and Safety instructions.
Prior to the beginning of the experiment, professor Afete Musliu informed students on potential risks and hazards when dealing with open water streams and the importance of wearing safety equipment (waterproof boots, lifesaving jackets, gloves, safety clothing, etc.).
Professor Afete provided guidance and technical assistance throughout the experiment. Her instructions on health and safety were specific, and students were supposed to adhere to the following prior beginning with measurements:
- water stream or velocity must not be too high because students might expose themselves to the danger of falling into the river.
- the bottom of the riverbed should be free of logs, sharp rocks, deep holes, and anything that could cause falls or injuries.
- the river must not be too deep at the measuring site. If the depth is more than 1.2 m, no measurement actions should be taken.
- if the stream is deeper than 60cm a life jacket must be worn.
- no measurements are to be performed during heavy rains or thunderstorms.
Equipment
The equipment used for measuring the water discharge is the OTT MF Pro meter, which is the electromagnetic current meter for cost-efficient in-stream discharge measurement. The OTT MF Pro automatically calculates discharge, and its electromagnetic sensor head is maintenance-free, ideal for use in low-flow environments, and unaffected by large amounts of organic matter. As with conventional current meters, the sensor is guided through the measurement cross-section using the rod. The step-by-step menu of the handheld unit directs the user through these operations from the first to the last vertical. The measured point velocities are immediately shown on the display of the handheld unit and automatically stored. At the end of the measurement, the software uses the data recorded to calculate the total discharge according to recognized international standards.

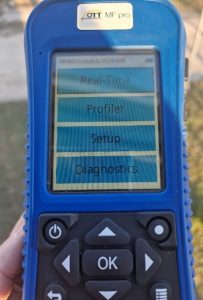
Fig. 2. OTT MF Pro used in water discharge measurements.
Task 1. Measure the river bank width
As per instructions from professors, team members split to each side of the riverbank to determine the river width. Two team members held the ends of a tape measurer at the points where the water meets the banks of the river. Team members paid attention not to twist the measuring tape, held it tensely stretched, and positioned themselves directly opposite to each other.
The width was determined to be 23.2m.
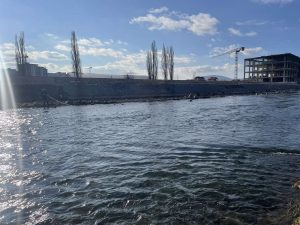
Fig. 3. Tape measurer stretched in order to determine the width of the river at the measurement point.
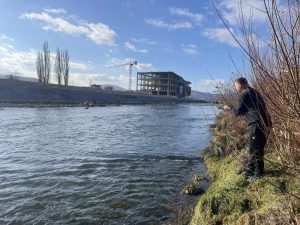
Fig. 4. Tape measurer stretched in order to determine the width of the river at the measurement point.
Task 2. Measure the river depth
Since the riverbed is not evenly configured and has variations due to terrain configuration, a team took measurements from more than one point since it would not be representative to take a single depth measurement.
Instead, several measurements were taken, depending on the variability of the channel depth and the width of the river channel.
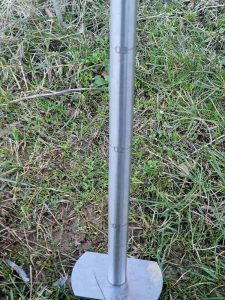
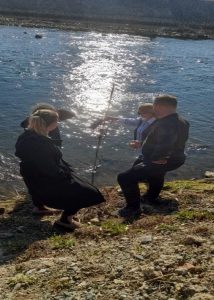
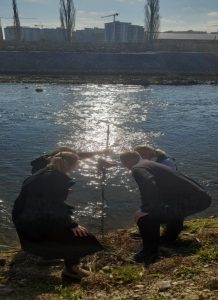
Fig. 5 – 7. Determining the river depth with a measuring rod
Task 3. Draft a riverbed terrain configuration diagram
| Point No | Depth | Point no | Depth |
| 1 | 15 cm | 11 | 37 cm |
| 2 | 23 cm | 12 | 33 cm |
| 3 | 34 cm | 13 | 27 cm |
| 4 | 36 cm | 14 | 24 cm |
| 5 | 38 cm | 15 | 21 cm |
| 6 | 47 cm | 16 | 19 cm |
| 7 | 51 cm | 17 | 17 cm |
| 8 | 55 cm | 18 | 15 cm |
| 9 | 50 cm | 19 | 13 cm |
| 10 | 45 cm | 20 | 10 cm |
Table 1. Depths of the river measured at points 01 – 20
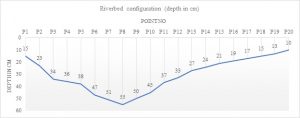
Graph 3. Depth curve of the measuring site
Task 4. Identify minimum 20 subsections to be measured
In order to determine the total discharge, we must first perform the velocity and depth measurements, parameters needed to compute the total volume of water flowing past the determined line during a specific interval of time. Usually, a river is divided into 20 to 25 regularly spaced subsections across the river. The team decided to split the width measurement into 20 subsections. We used a measuring tape to determine the width of each subsection.
Total width of the river at the measuring site = is 23.2m
Therefore, total width/20 = 23.20/20 = 1.116m = 116cm = each subsection width
Team members used this 116 cm interval at 20 equally spaced points across the river.
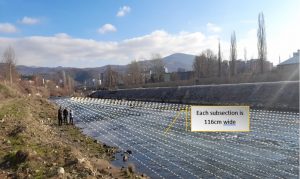
Fig. 8. Division of river into 20 subsections (20 equally spaced points at 116cm intervals.)
Tasks 5. Measure the flow velocity at each subsection.
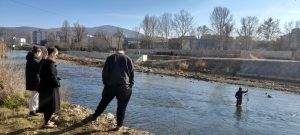
Fig. 9. Water velocity measurements
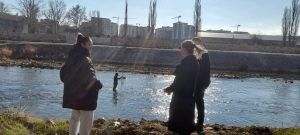
Fig. 10. Water velocity measurements
In order to get the most accurate results it is desirable to take at least two readings (at surface and at the bottom) at each subsection deeper than 20, and then calculate their mean readings.
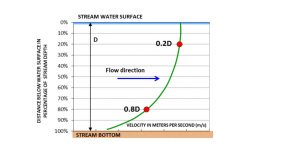
Graph 4. Two points method for measuring the flow velocity of each subsection
| Point no | Depth (cm) | Velocity at surface | Velocity at the bottom | Average velocity |
| 1 | 15 | n/a | 1.112 | 1.112 |
| 2 | 23 | n/a | 1.220 | 1.220 |
| 3 | 34 | 1.590 | 1.490 | 1.540 |
| 4 | 36 | 1.687 | 1.533 | 1.610 |
| 5 | 38 | 1.866 | 1.639 | 1.753 |
| 6 | 47 | 1.967 | 1.806 | 1.887 |
| 7 | 51 | 2.411 | 2.233 | 2.322 |
| 8 | 55 | 2.436 | 2.237 | 2.337 |
| 9 | 50 | 2.022 | 1.959 | 1.991 |
| 10 | 45 | 1.971 | 1.718 | 1.845 |
| 11 | 37 | 1.698 | 1.547 | 1.623 |
| 12 | 33 | 1.611 | 1.569 | 1.590 |
| 13 | 27 | 1.535 | 1.342 | 1.439 |
| 14 | 24 | 1.281 | 1.115 | 1.198 |
| 15 | 21 | 1.212 | 1.171 | 1.192 |
| 16 | 19 | n/a | 1.203 | 1.203 |
| 17 | 17 | n/a | 1.154 | 1.154 |
| 18 | 15 | n/a | 1.127 | 1.127 |
| 19 | 13 | n/a | 1.115 | 1.115 |
| 20 | 10 | n/a | 1.103 | 1.103 |
Table 2. Depths and water velocity were measured at points 01 – 20.
Task 6. Calculate the total discharge
In order to compute the total volume of water flowing past the line during a specific interval of time we will utilize the velocity measurements at each subsection and their depth measurements. First, we have to determine the Area by multiplying the Depth of each subsection with the Width of each subsection, and then calculate the Discharge by multiplying the Area with the Velocity of each subsection, and sum the results for every subsection in order to get a total Discharge in m3/s.
(Wi x Di) Area=Depth x Width
(Q)= Σ(Wi x Di) x Vi Discharge (Q) = Σ of Area x Velocity
Where:
Q is Discharge
Wi is the average width of the subsection
Di is depth of the subsection and
Vi is velocity.
| No | Wi (cm) | Wi (m) | Di (cm) | Di (m) | Vi (m/s) | Discharge(Q)= ∑(Wi x Di) x Vi (m x m x m/s) |
| 1 | 120 | 1.2 | 15 | 0.150 | 1.112 | 0.200 |
| 2 | 120 | 1.2 | 23 | 0.230 | 1.220 | 0.337 |
| 3 | 120 | 1.2 | 34 | 0.340 | 1.540 | 0.628 |
| 4 | 120 | 1.2 | 36 | 0.360 | 1.610 | 0.696 |
| 5 | 120 | 1.2 | 38 | 0.380 | 1.753 | 0.799 |
| 6 | 120 | 1.2 | 47 | 0.470 | 1.887 | 1.064 |
| 7 | 120 | 1.2 | 51 | 0.510 | 2.322 | 1.421 |
| 8 | 120 | 1.2 | 55 | 0.550 | 2.337 | 1.542 |
| 9 | 120 | 1.2 | 50 | 0.500 | 1.991 | 1.195 |
| 10 | 120 | 1.2 | 45 | 0.450 | 1.845 | 0.996 |
| 11 | 120 | 1.2 | 37 | 0.370 | 1.623 | 0.721 |
| 12 | 120 | 1.2 | 33 | 0.330 | 1.590 | 0.630 |
| 13 | 120 | 1.2 | 27 | 0.270 | 1.439 | 0.466 |
| 14 | 120 | 1.2 | 24 | 0.240 | 1.198 | 0.345 |
| 15 | 120 | 1.2 | 21 | 0.210 | 1.192 | 0.300 |
| 16 | 120 | 1.2 | 19 | 0.190 | 1.203 | 0.274 |
| 17 | 120 | 1.2 | 17 | 0.170 | 1.154 | 0.235 |
| 18 | 120 | 1.2 | 15 | 0.150 | 1.127 | 0.203 |
| 19 | 120 | 1.2 | 13 | 0.130 | 1.115 | 0.174 |
| 20 | 120 | 1.2 | 10 | 0.100 | 1.103 | 12.227 m3/s |
Table 3. Calculation of total Discharge (Q)
Based on measurements conducted at this location, we can conclude that the total Discharge of water at the measuring site amounts to 12.227 m3/s (or approximately 12 cubic meters per second).
Disclaimer: The content of the report is for information only, not advice or guarantee of obtained results. The testing was an activity conducted by the professors and students engaged in the project. The equipment used in testing was a reputable and calibrated one, obtained through SKAT project activities and funded by the Swiss Agency for Development and Cooperation (SDC) and the Government of Kosovo programme on Integrated Water Resource Management.