Soil Analysis
A soil analysis is done in order to test the level of nutrients in soil and improve its nutritional balance by adding fertilizers or removing excessive amount of it. Primary nutrients in fertilizers are known as “The big 3” and those are Nitrogen, Phosphorus and Potassium or shortly NPK. Each of these nutrients play an important role in agriculture and crop production.
Why is soil testing important for agriculture?
- It provides Information to farmers on chemical composition of their soil.
- Farmers know the exact amount of nutrients they need to apply, as high or low level of fertilizers could negatively affect their soil, crops, underground waters or even air.
- By testing their soil regularly farmers produce more, which positively effects their income and also helps them manage and improve their yields, feeding more people.
Soil testing experiment
Professor Muharrem Salihaj from EAM (Environmental and Agricultural Management) department gathered a group of students in order to show them how to perform the soil sample analysis. The equipment used for this purpose was purchased through IBC-M INFORM project and professor Muharrem’s intention was to teach the students, by implementing theory to practice approach, the importance of proper soil analysis for agriculture and environment in general.
How to collect a soil sample
A collected sample of soil is as reliable as our ability to collect a representative sample from an area of interest. We collect samples by using clean equipment and this is a must, as the residues of some chemical components from previous sampling procedures could yield misleading and confusing results. Equipment needed:
- Shovel
- Hoe
- Soil auger
- Buckets
- Plastic bags
- Gloves
Sampling location
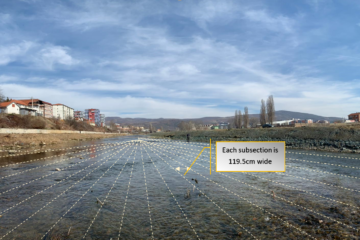
Soil samples were taken from a location near IBC-M Riverside campus:
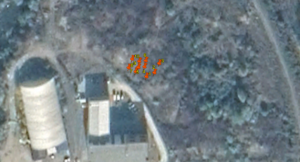
Figure 1. Soil sampling points at a location near IBC-M Riverside campus
This was our initial testing of the soil analysis equipment. We obtained it through Mitrovica Environmental Forum and Research Platform aka INFORM. We wanted to test the equipment, see how it works and therefore we decided to take a soil sample from the surrounding area of our campus.
Weather conditions
The soil samples were taken on January 22nd 2020, at 15.15h, the temperature was 3°C, it was sunny, sky was clear with random clouds appearing in the South direction. Humidity 64%.
The basic climatic characteristic of the municipality of Mitrovica is a moderate-continental climate which is a transition between the Mediterranean and the continental climate.
Winds and precipitation
There was a mild wind blowing in the North direction at speed of 1m/s. It was dry, it didn’t rain or snow.
Health and Safety
The IBC-M college is committed to providing a safe and healthy environment for students and its staff as provided in the college’s Health and Safety instructions. Prior to the beginning of the experiment, students were informed on potential risks and hazards when dealing with chemicals and importance of wearing safety equipment (goggles, gloves, safety clothing etc.) Professor Muharrem Salihaj provided guidance and technical assistance throughout the experiment.
How to collect a soil sample
It is important to emphasize that a soil sample taken from a single point of an agricultural field won’t provide optimal results and may lead us to wrong conclusions. It is of utter importance to take soil from at least 15-20 points on the farm in order to form a representative sample. Below are the examples of the most common sample collection pattern methods:
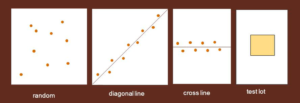
Figure 2. Sample collection patterns
A collected sample of soil is as reliable as our ability to collect a representative sample from an area of interest. Usage of clean equipment is a must as the residues of some chemical components from previous sampling procedures could yield misleading and confusing results. First of all, we must remove a litter from the surface of a sampling point. We can scrape off the litter with a hoe or a shovel, whatever tool we have with us.
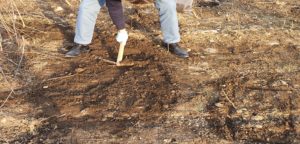
Figure 3. Dirt removal from the surface of a sampling point
After removing the dirt, which is usually in first 5cm of soil, we proceed with digging for the soil sample. Using a shovel, we dig a small V-shape hole up to a depth of 20 cm i.e. from the soil surface to 20 cm below the soil surface.
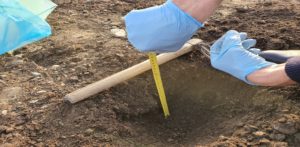
Figure 4. Depth measuring – 20cm in our case
Using bare hands, we collect the soil from the above-mentioned depth and carefully place it inside a clean bucket.
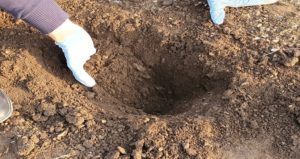
Figure 5. V-shaped hole, collecting a sample using hands.
After taking samples from all locations according to sampling plan, we thoroughly mix the all the samples inside a bucket, using hands. Once we mix all samples inside a bucket, we then take approximately 400-500gr of soil and place it inside a plastic bag for analysis. This would be our representative sample. We seal the bag, label it properly with basic information on soil sample location and date it was taken, details of a person who collected it and from what depth.

Figure 6. Placing samples inside plastic bag
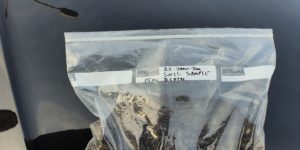
Figure 7. Proper sample labeling
Soil sample needs to be air-dried before proceeding with analysis. The optimal temperature is around 25ﹾC, in a well ventilated and dust-free room. We took out our soil sample from a plastic bag and spread it out, evenly, on a sheet of paper, leaving it to air-dry for 7-10 days.
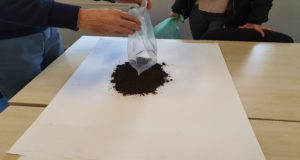
Figure 8. Placing soils sample on a sheet of paper for drying
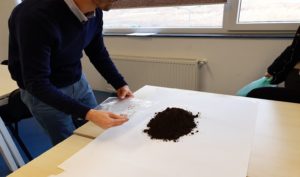
Figure 9. Air-drying process takes 7-10 days
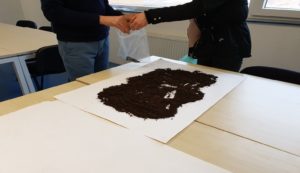
Figure 10. Removal of pebbles and plants’ roots from the soil sample
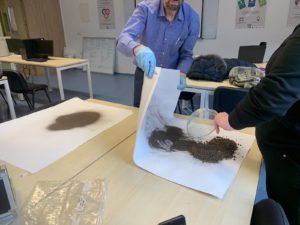
Figure 11. Sieving the soil sample using a 2mm sieve
Soil sample analysis
This next step in a process of soil analysis was taken a week later, on February 29th 2020, in the IBC-M premises. Professor Muharrem Salihaj gathered a group of EAM students and INFORM project team members in order to get them to experience, at firsthand, the prerogatives of working in the lab environment and conducting research/scientific work. Students actively participated in all steps of soil analysis process, alongside professor, who initially practically explained the process of soil analysis and later on closely monitored the student’s activities.
Equipment
The instrument used for the purpose of soil analysis was the Soil Nutrient Analyzer, produced by a company named Biolab, model TPY-6A. This instrument can measure for presence of Nitrogen, Phosphorus, Potassium (N-P-K), organic matter, pH, salinity, temperature and humidity in soil. It is portable as well, since it has a built-in battery and can be carried around in order to perform on-site analysis of soil samples.

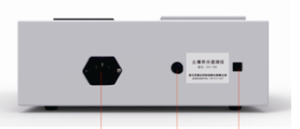
Figure 12. BIOLAB TPY-6A – Soil Nutrient Analyzer
What does N-P-K mean?
A soil analysis is done in order to test the level of nutrients in soil and improve its nutritional balance by adding fertilizers or removing excessive amount of it. Primary nutrients in fertilizers are known as “The big 3” and those are Nitrogen, Phosphorus and Potassium or shortly N-P-K. Each of these nutrients play an important role in agriculture and crop production.
- Nitrogen is critical in the formation of proteins and proteins are something that most of the plants are made of, humans and animals as well. Nitrogen makes sure that crops develop properly and are nutritious when consumed by humans or animals.
- Phosphorus is vital for plant growth and is linked to plant’s capacity to store and transfer energy, it is also important for photosynthesis process, movement of nutrients in the plant and transformation of starches and sugars.
- Potassium helps plants in becoming more resilient to diseases, it plays an important role in CO2 uptake, and strengthens their root system.
Prior to first use, the equipment was calibrated according to an instruction manual. Calibration is the process of comparing a reading on one piece of equipment with a standard, known set of parameters. It is performed in order to make that sure we will get the most accurate and valid results.
Following the calibration process, professor Muharrem and students began with the soil sample analysis.
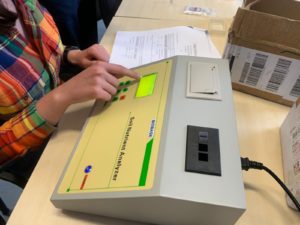
Figure 13. Initial equipment calibration
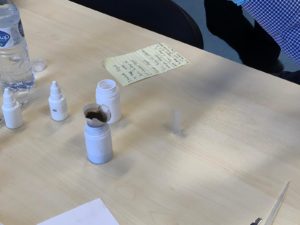
Figure 14. Filtering of a soil sample
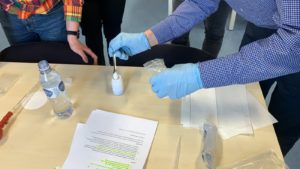
Figure 15. Adding powdered chemical component to a filtered sample
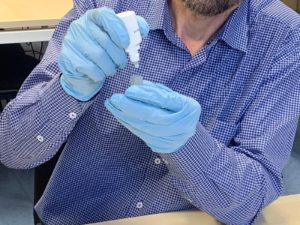
Figure 16. Adding liquid chemical component to a filtered sample
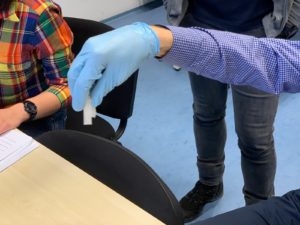
Figure 17. Mixing the content of a lab couvette

Figure 18. Placing the couvette inside the analyzer

Figure 19. Scrolling through the interface for results
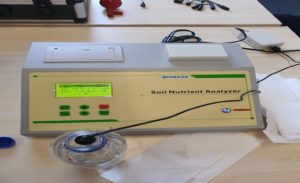
Figure 20. pH probe calibration
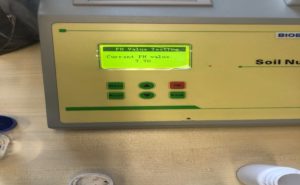
Figure 21. pH value readings

Figure 22. Printing the results of a soil analysis
Conclusion
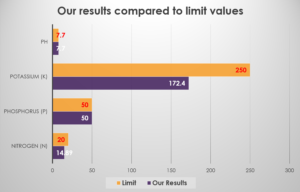
The results of soil analysis were not a surprise at all. The concentration of N-P-K in soil sample we collected was within optimum range, in case of all three elements measured Nitrogen (N), Potassium (K), and Phosphorus (P). The pH level of soil sample tested was within optimum range as well.
| Element | Soil analysis results | Ideal range | Concentration |
| Nitrogen (N) | 14.89 ppm | 2 – 20 ppm | Within range |
| Phosphorus (P) | 50 ppm | 30 – 50 ppm | Within range |
| Potassium (K) | 172.4 ppm | 150 – 250 ppm | Within range |
| Potential Hydrogen (pH) | 7.70pH | 5.50 – 7.70 | Within range |
One must bear in mind that soil analysis results may differ from one crop to another. Not all crops require the same amount of fertilizer.
Applying too much or the wrong kinds of fertilizer can harm your crop and be a costly waste of time and investment.
We wish to express our sincere appreciation and gratitude to IBC-M professor Muharrem Salihaj who took his time and effort to help students grasp what they learned in theory and then utilize it in practice. He made all participants feel very comfortable and was very approachable during the process. His knowledge on the subject of soil analysis was extensive and he is certainly a role model for students and their careers in environmental and agricultural management.